Showing posts with label Steer Davies Gleave. Show all posts

Wednesday, 11 September 2013

British Cartographic Society Award Winners 2013

The British Cartographic Society (founded in 1963, and celebrating their 50th Anniversary this year) has been recognising good map design through their Awards since 1978. The Awards system is designed to encourage entrants across all cartographic disciplines, and to showcase products created through traditional, new or experimental techniques. They aim to promote the best of cartographic products and highlight excellent cartographic design in the UK and abroad. 

The 50th Anniversary Symposium was held at Hothorpe Hall, Leicestershire and welcomed 11 past presidents back to The BCS to join in the celebrations.

Congratulations to all the award winners and runners up of 2013. Please see the website for more details on each winner. http://www.cartography.org.uk/awards

Categories:
Stanfords Award Winner - Mary Spence, Global Mapping for "The World"
Stanford Highly Commended entry -  Mike Murphy, University of Cork for "The Atlas of the Irish Famine"

Avenza Award Winner - Clare Seldon, Steer Davies Gleave for  "Swindon Journey Planner"

Ordnance Survey Open Data Award Winner - Ashley Clough, Parallel for "Interactive UK Healthcare Data Visualiation"
Ordnance Survey Open Data Highly Commended entry - Caroline Robinson, Clear Mapping for "Summer in February" Film Estate Maps

John C Bartholomew Award Winner - Peter Fretwell, British Antarctic Survey for "Bedmap2: Bedrock Topology of Antarctica
John C Bartholomew Highly Commended entry -  Mike Murphy, University of Cork for "The Atlas of the Irish Famine"

BCS Award:
This is presented to the entry judged to be the best from the four award winning entries presented this year from:

* The Stanfords Award won by Global Mapping;
* The Avenza Award won by Steer Davies Gleave;
* The Ordnance Survey Open Data Award won by Parallel; and
* The John C. Bartholomew Award won by British Antarctic Survey

We have the pleasure in announcing that the BCS Award is presented to: Mary Spence, Global Mapping for "The World"

Symposium attendees at Hothorpe Hall, Leics
---
all photography by Martin Lubikowski @MartinMLDesign

Saturday, 30 March 2013

BCS President’s Report March 2013

It’s always the way isn’t it, very few cartographic related anniversaries in February and then too many in March.
This month sees the 200th anniversary of the birth of Dr John Snow and for anyone who has attended a Better Mapping seminar, the first map will be very familiar to you as it is used by Giles Darkes as part of his talk illustrating how you can present statistical data using maps.
http://en.wikipedia.org/wiki/John_Snow_(physician)
Although he is better known as one of the founding fathers of modern epidemiology, Dr. John Snow produced this map of the area around the Broad Street pump to illustrate his hypothesis that cholera reproduced in the human body and was spread through contaminated water. This contradicted the prevailing theory that diseases were spread by "miasma" in the air. The September 1854 cholera outbreak was centred in the Soho district, close to Snow's house. Snow mapped the 13 public wells and all the known cholera deaths around Soho, and noted the spatial clustering of cases around one particular water pump. He examined water samples from various wells under a microscope, and confirmed the presence of an unknown bacterium in the Broad Street samples. Despite strong scepticism from the local authorities, he had the pump handle removed from the Broad Street pump and the outbreak quickly subsided. Snow subsequently published a map of the epidemic to support his theory.
In his talk Giles cleverly shows how the results can be ‘manipulated’ depending on how you categorise the data. If the area around the pump is partitioned in different ways, it can seriously skew the data and even suggest that the Broad Street pump is not necessarily the problem. A cautionary tale that is still valid today in reminding us that the aggregation and categorisation of data for portrayal graphically is vitally important to the message that we are trying to convey cartographically. Indeed, some anomalies are worth noting. Although the large workhouse just north of Broad Street housed over 500 paupers, it suffered very few cholera deaths because it had its own well (not shown on the map). The workers at the brewery one block east of the Broad Street pump could drink all the beer they wanted; the fermentation killed the cholera bacteria, and none of the brewery workers contracted cholera. Many of the deaths further away from the Broad Street pump were people who worked at the market on Broad Street and drank from that well.

For anyone wishing to find out more, there is an exhibition at the London School of Hygiene & Tropical Medicine, Keppel Street, London WC1E 7HT entitled ‘Cartographies of Life & Death – John Snow and Disease Mapping’. It opened on 15th March and runs until 17th April. 

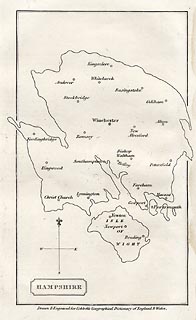
Our second anniversary this month is the 250th anniversary of the birth of William Cobbett, best known for his book Cobbett’s Rides, a topographical narrative of his travels around the south east of England still available in Penguin Classics form. The map I have chosen to illustrate this was published in A Geographical Dictionary of England and Wales, by Cobbett in 1832. The map shows an outline of Hampshire, in an almost unrecognisable shape - either a very strange projection or a bad map! The only features are the main towns.

Cobbett was born in Farnham, Surrey, and his grave can still be seen in the parish churchyard. At various times he was a sergeant-major in the British Army, a campaigning journalist, a political prisoner, an exile in America, the editor of journals, and the Radical MP for Oldham. In the 1820s he returned from political exile in America and undertook a series of rides through the countryside as the basis for a series of articles for publication in his own journal The Political Register. In 1830, he made a selection of the rides and published them in book form. http://www.geog.port.ac.uk/webmap/hantsmap/hantsmap/cobbett/cobbett1.htm         

Coming far more up to date for our third anniversary, this one actually happened 50 years ago when on 27 March 1963 the Chairman of British Railways Dr Richard Beeching issued a report calling for huge cuts to the UK's rail network.The map shows just how extensive our rail network used to be and even this one doesn’t show all the smaller branch lines that criss-crossed the country at the time. The initial report proposed the closure of over 6000 miles of railway and over 2300 stations. Some were reprieved, but over 1900 stations did close and the many ‘dismantled railway’ annotations that appear on OS maps bears testimony to just how many miles of track were decommissioned, with lots of the former lines now forming part of our long distance footpath or national cycle network routes.As one commentator noted, the name ‘Beeching’ quite often evokes a response normally associated with mass murderers and the report was deeply unpopular at the time. The Beeching closures failed in their attempt to eliminate BR's losses, achieving a saving of just £30 million, whilst overall losses were running in excess of £100 million per year. Beeching himself was unrepentant about his role in the closures: "I suppose I'll always be looked upon as the axe man, but it was surgery, not mad chopping." 


What do the following have in common?
  • Maps as music
  • Edwardian transport planning
  • Smells of Paris
  • Pacman
  • The map of 1000 cuts
  • Maps in the media
  • Word maps
They all featured in the Design Group’s excellent one-day workshop entitled ‘How maps inspire us’ at the Steer Davies Gleave offices on 14th March. It really was a fascinating day that took aspects of cartography that we are familiar with but looked at them from a totally different viewpoint.
We were treated to some very engaging talks from a range of speakers and it was noticeable that similar themes kept being picked out. The underlying theme was the sense of place and how we move from being in a ‘space’ to being in a ‘place’ by the things that we associate with it through a variety of senses.. We considered the associative elements of senses and what reminds us most of particular locations – think how often a smell can make you remember a particular place.

Looking ahead:
  • If you haven’t yet booked for the talk by Michael Palin at the RGS on 12th April it’s not too late to do so. Entitled ‘A life in Maps’, it promises to be a fascinating evening from one of our ‘National Treasures’. Book your ticket now
  • BCS will have a panel on the IMIA stand at the London Book Fair from 15th-17th  April, so if you are attending, please make sure that you come and visit us to see the pre-publication details of the BCS 50th anniversary book. Due for publication later this year the book celebrates 50 years of the Society by selecting a UK event and world event from each year and illustrating it with an appropriate map.
    Pre-publication price will be £12.50, so keep an eye on the website in the near future for details.  
Pete Jones MBE, CGeog, FRGS
26th March 2013

Thursday, 9 August 2012

BCS Presidents Report July/August

Dear Members
I thought it would be a good idea to have one report that covered both July and August as, unsurprisingly, we only have one event in August which is the Map Curators meeting in Leeds, 29-30 August. So Map Curators if you haven’t signed up already please do so.

On 13 July I was invited to the British Library for the launch of the Earth Platinum Atlas produced by Millennium House in Australia. It is the largest atlas in the world and just 31 copies will be produced. If you’d like to take a look (or buy one for $1000,000?) check out some images.

On 19 July there was a UK GEOForum meeting in London. The Forum has representatives from 14 associations/societies in geography and mapping industries and is an excellent group facilitating discussions of matters of the moment within the industry and co-operative ventures with organisations like the AGI, RGS and GA.
Indeed, there was a Better Mapping II event in London on 26 July which was organised in co-operation with the AGI and kindly hosted by our ‘initialsakes’, the British Computer Society. No problem with attendees, even just the day before the Olympic Opening Ceremony in London, with all 45 places filled. My thanks must go to our speakers: Peter Jones, Mary Spence, and Clare Seldon. Clare works for Steer Davies Gleave who are very supportive of these events – thank you too.

So after the Map Curators meeting at the end of August, we have a Council meeting on 6 September in London, and we hope to have a stand at the AGI Conference, 19-20 September at The East Midlands Conference Centre in Nottingham.
Then we have our first 2 day Restless Earth Schools Workshop in Penarth, 26-27 September. Looking further ahead still and to give you a ‘heads-up’, the GIS SIG will meet in London on 24 October at our ‘initialsakes’ offices and our AGM/Lecture/Dinner event will be at the RAF Club on 31 October starting at 1700.

Finally, on a personal note, some of you will be aware that I retired from Esri on 30 June after 15 years. I spent my first 5 years working for Esri UK and the remainder for Esri Inc in Redlands. You can’t be President of an organisation such as BCS without the full support of your employer and Esri in Redlands couldn’t have been more helpful. Closer to home, Esri UK are Corporate Members of BCS and sponsors of our Symposium so thank you too.

Let’s hope we have some more sunshine and we can all enjoy the August break.
Best Wishes

Peter Jolly
President of The British Cartographic Society

Sunday, 3 July 2011

Public Transport GeoInformation Workshop, Paris


After a lovely sunny few days at IGN, Paris I am now back in London thinking about what will come next for PTI and cartography in the future... I'm looking forward to meeting up with some of the new contacts I've made so here's a little overview of what went on and what's planned next...

The Use and User Issues Commission concentrated this year on Public Transport GeoInformation and as I have been involved in PT mapping my whole career I found it a very informative workshop and gladly welcomed it. Access to mapping for the public has never been higher, and I expect that PT maps are a very large share of the market and yet we have no groups in the UK, or abroad that I'm aware of, that specialise in bringing the commissioners, creators and users of these maps together to collaborate and push the field forward.
Now, after this inaugural workshop I believe we have a better understanding of the wider issues, not just within our own sectors, like academia or commercial, but we can also see how we can use each others strengths to make PT mapping better for the user.
Many thanks to the organisers, BCS Council and Commission Vice President David Forrest, Chair - Corne van Elzakker and IGN/Cogit's Dr Catherine Domingues, as well as the event sponsors Steer Davies Gleave and COGIT.


It was a great success and well received by everyone I spoke to. Delegates arrived from as far away as Brazil, and the European attendance was high, ranging from Switzerland, Sweden, Austria, The Netherlands, UK and France to name a few.

As well as several presentation sessions and demo's over the two days delegates also carried out a user test to more or less success! We were instructed to visit several locations by PT and asked to record the planning and user decisions along the way, to facilitate a discussion on Paris signage and wayfinding facilities. Alex Pucher of University of Vienna is to collate the info and we hope that from the findings we can, as a group, identify some of the main issues in this area for users.
I look forward to seeing and assisting with the next steps in this process and I encourage anyone else with an interest in this area to help us gather this information so we can all learn from it and move the industry forward positively. Please check out the Commission's website where you will be able to see the outcomes of our work and contact us to find out more or participate.

Sunday, 12 June 2011

BCS Symposium 2011 - The Power of the Image DAY 2

Day 2 talks now available on the BCS website at Presentations

The first session - Speciality Mapping helped to highlight the research being carried out by not only universities but our very own Ordnance Survey as well, into non-visual or vision deficiency in location based products.

The imaginative ways highlighted really gave us something to think about how our maps are perceived by these users, and how we can integrate our mapping with these researched methods to assist users, and open up location navigation to a wider audience.


Workshop sessions then followed including Cartographic Surgery with Global Mapping, Understanding INSPIRE with AGI and RSW Geomatics, Making Sense of Statistics on Maps with Giles Darkes,  Create your own 3D city model without sticky-back plastic with Autodesk, and a Visit to Macclesfield Silk Museum.
A great lunch was sponsored by some of our supporting corporate members including Autodesk, Bentley, Cadcorp, ESRI, Europa Technologies, Ordnance Survey, Victoria Litho, GISPro, Imray Laurie Norie & Wilson, STAR-APIC, Global Mapping, Newgrove Consultants and Steer Davies Gleave.

At 2pm the second talks session of the day started endeavouring to answer Where are we now?.
Both Europa Technologies and Steer Davies Gleave presented slides to provoke us in thinking about the new open data available and how we can use it to create cartographic products for our users. Encouraging more integration with media files and new technology was a key theme. Dr David Fairbairn, from ICA, then summarised how the ICA have developed commissions and workshops to carry out research work and indicated concrete results from the efforts of cartographers around the world in advancing the discipline.

A busy day of lectures and workshops was then concluded with The Helen Wallis lecture, this year given by Peter Barber (Head of British Library Map Collections, and curator of the British Library's fascinating exhibition Magnificent Maps) on The Map as Symbol.
From depictions on coins and medals right through to grand world maps in royal palaces, a map has appeared on objects from very early beginnings to act a status symbol - just take a look at the size of  Charles II's The Klencke Atlas opposite. Pictured here with Peter.
Curator of Magnificent Maps - Power, Propaganda and Art

Blog List