Showing posts with label Anniversary Book. Show all posts

Friday, 20 December 2013

BCS President’s Monthly Bulletin December 2013


Anniversaries
So we come to the final bulletin of our 50th Anniversary Year and December was obviously a quiet month in 1963! There are very few really ‘mappable’ events from 50 years ago, but one that does lend itself is Kenya’s independence.

As the BBC reported it at the time:

Jomo Kenyatta is certain to become prime minister after his party, Kenya African Nation Union, won the country's first general election.
Thousands of Kenyans ran through the rain-drenched streets of Nairobi tonight cheering at news of the results.”

At a time when the celebrations for the life of Nelson Mandela have just taken place, there are some poignant echoes from Kenyatta’s speech in which he said that although his government aimed to free itself from British colonialism, it would not try to avenge past injustices.

"We are not to look to the past - racial bitterness, the denial of fundamental rights, the suppression of our culture... Let there be forgiveness," 

Kenya is now the biggest and most advanced economy in east and central Africa but it is still a poor developing country. The important agricultural sector is one of the least developed, employing 75 percent of the workforce. 

Despite western donors' early disillusionment with the government, the economy has seen much expansion, evidenced by strong performance in tourism, higher education and telecommunications.

For an eighteen day period, from 19 Dec 1963 – 5 Jan 1964, the Berlin Wall was opened for the first time, allowing West Berliners to visit family living in East Berlin during the Christmas season. One-day permits were required. In what was a foretaste of things to come, this could be considered a brave move on the part of the authorities at the height of the Cold War.

Under an agreement reached between East and West Berlin, over 170,000 passes were eventually issued to West Berlin citizens. Loudspeakers in East Berlin greeted visitors with the news that they were now in "the capital of the German Democratic Republic," a political division that most West Germans refused to accept. Each visitor was also given a brochure that explained that the wall was built to "protect our borders against the hostile attacks of the imperialists." On the West Berlin side, many newspapers berated the visitors, charging that they were pawns of East German propaganda.

Cartography in the news
Just one article this month. The healthy debate on Sat Navs v Atlases will be going on for some time yet and I came across a well-balanced, short article that manages to come to a nice compromise:

Posted by Louisa Keyworth at BCS Corporate Member, Lovell Johns, it does contain the rather worrying quote, “With geography in schools containing less teaching on map reading, two thirds of under 25s would literally be lost if you asked them to read a map, research has claimed.”
Obviously we need to refocus Restless Earth on UK Road Atlas skills!

Mary Baker Eddy Library Mapparium

I came across this stunning piece of cartographic art via a twitter post and have been amazed by the sheer scale of the Mapparium. This glass globe is located in the Mary BakerEddy Library in Boston, Massachusetts. It is constructed of 608 glass panels based on the 1934 Rand McNally world map. The Rambusch Glass Company artists traced these maps onto 1/4 to 1/2 inch thick glass panels and painted them with a coloured powdered glass mixture. Each panel was then fired in a kiln to fuse the colour to the panel. Construction on the Mapparium began in April 1934 and by January 1935 the glass panels were being produced at a rate of about 50 per week, with production accelerated to complete the entire project for June 1st 1935. Once the panels were completed, they were fitted into the spherical bronze frame forming a 10° by 10° graticule that holds the entire structure together. Finally, 300 light bulbs were installed to illuminate the globe from the outside. The total cost for the project was about $35,000 (about $600K in current terms).

Designed by Boston architect Chester Lindsay Churchill, he called his installation the “Mapparium”. It was an immediate and overwhelming success. Within the first four months, more than 50,000 people had come to experience "being at the centre of the earth".

Despite being on a concave surface, which is the complete opposite of how we normally view a globe, it just looks right. Distances, areas and relative locations are all perfectly maintained and as the eye is always the same distance from the object, it doesn’t encounter the distortions that looking at a normal globe introduce.

The Mapparium was renovated in 1998 when a new light and sound system was installed and the panels were cleaned and repaired. On three occasions in 1939, 1958, and again in 1966, different committees discussed updating the map to reflect the geopolitical changes that had taken place since 1934. In 1966, the estimated cost was $175,000 to create and install new glass panels. It was decided that the Mapparium held much more value as an art object, and the idea of updating it was finally dropped.

It remains the only one of its kind, a truly unique cartographic item. I did muse in my twitter feed that it would be nice to have one on this side of the Atlantic as well. We learnt a lot about the UK glass industry during the Black Country Experience weekend, so if anyone knows of a donor with about £400,000 that they are looking to invest and a building with a space large enough to house it please do let me know!
(images provided by kind permission of the Mary Baker Eddy Library)

Better Mapping
We will be looking at a new format for the Better Mapping Seminars in 2014, based on what we have done before but revamped and refocused on web cartography and designing for multiple media. There will still be an opportunity to look at examples of what works and what doesn’t work and I came across a good example recently of a map that at first glance looks good, but then you start to see problems. I am not going to ‘name and shame', you will have to come along to the seminars to find out. Suffice to say that it was produced by a design company, not a cartographic firm and from their website you do get the impression of a certain lack of understanding.

“Mapping


Maps are a perfect example of the importance of good information design. They are functional items and not like conventional packaging or written instructions. Packaging has to be attractive, in the true sense of the word, and information design must be attractive too, in order to capture the readers’ attention in the first place. However, the primary function of any map is to help the user to plan or find his way.

Producing one that achieves this is no mean feat and it is routinely under-estimated how complex a task it actually is – when done well. Maps can fail in two basic ways: they can of course simply be inaccurate and the outcome becomes obvious, but often only when used; they can also fail when the factual content is sound, but presented poorly. Everything on a map is symbolic and all facts are conveyed by implication alone. Maps are not like written instructions and a high cognitive load is being put on the user.

Different situations require different mapping solutions. A geographical map may be ideal in one context and a straight line diagram better in another. Scale is usually very important and simply making a map bigger or smaller is not what scale is about. Scale is about proportion and content.”

Restless Earth
I am very pleased to confirm that the Great Britain Sasakawa Foundation (GBSF) have approved a grant of £2,500 to support the BCS RestlessEarth programme. This is the second consecutive year that the GBSF have supported us with a financial grant and it enables us to continue to offer the workshops to schools totally free of charge. We are very grateful for their continued support. To find out more about GBSF, please visit their website at www.gbsf.org.uk/.

And Finally…
As we come to the end of our 50th Anniversary Year, I hope that you will agree that it has been an incredibly successful celebration of The Society. We crammed an incredible amount into the last 12 months, have had some very high-profile speakers, run an excellent Symposium, published our 50th Anniversary Book and participated in a wide range of cartographic and geographic events. We have recruited over 100 new members this year and our total membership is now around 700. I would like to thank everyone who has helped to make this year such a resounding success.

Do you read this far? I recently asked on Twitter if anyone new of a good explanation of what differentiates a chart from a map. It was sparked by a book that I am currently reading, from which the following is an extract:

“The stock-in-trade of this old gentleman comprised chronometers, barometers, telescopes, compasses, charts, maps, sextants, quadrants, and specimens of every kind of instrument used in the working of a ship's course, or the keeping of a ship's reckoning, or the prosecuting of a ship's discoveries.”

So my Christmas quiz question is, “What is the name of the ‘old gentleman’ referred to in the extract? First correct answer e-mailed to the address below wins a £10 voucher of their choice (Book, ITunes, M&S, etc).

Best Wishes for a Very Merry Christmas and a Happy New Year – let’s hope that 2014 proves to be as exciting and inspiring as this year has been.

Pete Jones MBE, CGeog, FRGS
20th December 2013

Twitter: @geomapnut

Friday, 31 May 2013

BCS President's Report May 2013

31st May 2013

Lots of anniversaries this month, so no problem at all in filling space or having to scratch around for tenuous links to historic moments.

On the 17th May 1943, 19 Lancasters from 617 Squadron took off from RAF Scampton on Operation CHASTISE, better known simply as the "Dambusters Raid". The 70th anniversary was marked by a number of events including the "Battle of Britain Memorial Flight" Lancaster PA474 conducting a flypast over Derwent Water Reservoir in the Peak District, one of the reservoirs and dams used in training for the mission. Having been flown for much of her service with the BBMF as the "City of Lincoln", PA474 presently wears the markings of the "Phantom of the Ruhr", a Lancaster that flew 121 sorties. Just 3 of the original 133 crew are still alive: George Johnson, Les Munro and Frederick Sutherland. The map below shows part of the planned flight path to the dams.

Compared to today's pilots they flew incredibly low at 60ft to avoid detection. Given the lack of any sophisticated navigation aids it’s no wonder that at least one aircraft flew into power cables and another ditched in the sea. They also had to fly virtually the whole mission in the dark for the night-time raids and had to work out ways of maintaining exact height and distance from the dams so that the bombs hit the top of the dams and then dropped down, exploding by pressure fuse at what was assessed to be the weakest part of the dam.
If you have read your latest edition of Maplines, you will have noticed that the Historic Military Mapping Special Interest Group of the BCS is planning an autumn event that will tie in with the anniversary of the Dams raid. This will be a weekend in October based around a visit to the Lincolnshire Aviation Heritage Centre at East Kirkby airfield.This will include an opportunity to see their Lancaster, NX611"Just Jane", which is being refurbished with a view to making it airworthy again. At the moment it is only certified for tail-up taxi runs, sufficient speed to lift the tail wheel off the ground but no more.

Sixty years ago, on 29th May 1953, Sherpa Tenzing Norgay and Edmund Hillary became the first people to climb Everest. What has nowadays become a fairly regular occurrence; their feat was certainly ground breaking at the time, done without modern equipment, although they did have high altitude boots, rubber walkie-talkies and experimental oxygen tanks. May is traditionally one of the best times of the year to climb Everest, and this year has been one of the most crowded seasons with more than 500 people having scaled the mountain since the start of 2013.
Since the first successful climb, more than 4,500 people have reached the top. Amid the celebrations there are concerns about the growing number of climbers on Everest and the pollution they cause, so much so that Nepalese officials are now considering placing a limit on the number of climbers allowed to ascend Everest.
Interesting fact – the mountain as named after Colonel Sir George Everest, Surveyor-General of India from 1830 to 1843, whose name was pronounced Eve (as in the girl’s name) Rest, so by referring to it as Ev-e-rest we have been pronouncing it wrongly all these years!

This is one that I missed last month, but I wanted to include a slightly quirky map-related topic. Kenneth Ira Appel died on April 19 2013. If this is not a name that is immediately familiar, he was an American mathematician who in 1976, with colleague Wolfgang Haken solved one of the most famous problems in mathematics, the "Four Colour Theorem". They proved that any two-dimensional map, with certain limitations, can be filled in with four colours without any adjacent "countries" sharing the same colour. The proof has been one of the most controversial of modern mathematics because of its heavy dependence on computer "number-crunching" to sort through possibilities, which drew criticism from many in the mathematical community for its inelegance, including the comment "a good mathematical proof is like a poem—this is a telephone directory!”

The "map" on the left was designed to celebrate the 2013 Chelsea Flower Show. One hundred years ago, the RHS Chelsea Flower Show was held for the first time. Back in 1913 it was a three-day affair with 244 exhibitors, about half of them nurseries and a third sundriesmen (manufacturers of glasshouses, retailers of gardening tools and chemicals, stands for gardening magazines and makers of garden furniture). The remainder were a mixture of amateur gardeners, most representing the still-thriving world of country-house gardening, and professional garden designers. The RHS had held a Great Spring Show since 1862, but it moved to its current home and assumed the title in 1913. We haven’t yet hit the hundredth show as it was cancelled in 1917 and 1918 and for the whole of the Second World War.

Sundriesman is probably a word that is unfamiliar to most and is one of those professions that has become rare if not ceased to exist. In a recent article online entitled “Is Cartography Dead?”, the author speculated, "if “cartographer” is soon to be listed alongside “cooper” and “cartwright” in the tally of occupations of yesteryear?” Happily the author goes on to conclude that the answer to his question is “no”, full details at  http://blog.visual.ly/is-cartography-dead.

GeoDATA 2013 
The Society recently participated in the GeoDATA seminars in Birmingham and Sheffield and gave presentations on why cartography is still important, hopefully I helped to reinforce the message that cartography is still thriving. The talks went down well at both venues and encouraged a lot of questions at the stand afterwards. Both days were very busy and I signed up a number of new members at the events, four in Birmingham and five in Sheffield, so I'd like to say "Welcome!" to those receiving their first President’s monthly. The free to attend GeoDATA events continue during 2013 and BCS will have a presence at most, if not all, culminating in London in November. If you can help to man the stand in Edinburgh on 7th November or in Belfast on 21st November then please let me know.
And Finally 
The BCS 50th Anniversary Book is almost ready to go to press. We are offering this at a pre-publication price of £12.50 plus £2.50 P&P and have extended the deadline to 30th June. After this the book will be £15.00. See the website for full details.

Pete Jones MBE, CGeog, FRGS

Saturday, 30 March 2013

BCS President’s Report March 2013

It’s always the way isn’t it, very few cartographic related anniversaries in February and then too many in March.
This month sees the 200th anniversary of the birth of Dr John Snow and for anyone who has attended a Better Mapping seminar, the first map will be very familiar to you as it is used by Giles Darkes as part of his talk illustrating how you can present statistical data using maps.
http://en.wikipedia.org/wiki/John_Snow_(physician)
Although he is better known as one of the founding fathers of modern epidemiology, Dr. John Snow produced this map of the area around the Broad Street pump to illustrate his hypothesis that cholera reproduced in the human body and was spread through contaminated water. This contradicted the prevailing theory that diseases were spread by "miasma" in the air. The September 1854 cholera outbreak was centred in the Soho district, close to Snow's house. Snow mapped the 13 public wells and all the known cholera deaths around Soho, and noted the spatial clustering of cases around one particular water pump. He examined water samples from various wells under a microscope, and confirmed the presence of an unknown bacterium in the Broad Street samples. Despite strong scepticism from the local authorities, he had the pump handle removed from the Broad Street pump and the outbreak quickly subsided. Snow subsequently published a map of the epidemic to support his theory.
In his talk Giles cleverly shows how the results can be ‘manipulated’ depending on how you categorise the data. If the area around the pump is partitioned in different ways, it can seriously skew the data and even suggest that the Broad Street pump is not necessarily the problem. A cautionary tale that is still valid today in reminding us that the aggregation and categorisation of data for portrayal graphically is vitally important to the message that we are trying to convey cartographically. Indeed, some anomalies are worth noting. Although the large workhouse just north of Broad Street housed over 500 paupers, it suffered very few cholera deaths because it had its own well (not shown on the map). The workers at the brewery one block east of the Broad Street pump could drink all the beer they wanted; the fermentation killed the cholera bacteria, and none of the brewery workers contracted cholera. Many of the deaths further away from the Broad Street pump were people who worked at the market on Broad Street and drank from that well.

For anyone wishing to find out more, there is an exhibition at the London School of Hygiene & Tropical Medicine, Keppel Street, London WC1E 7HT entitled ‘Cartographies of Life & Death – John Snow and Disease Mapping’. It opened on 15th March and runs until 17th April. 

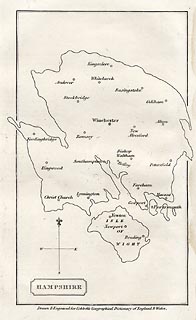
Our second anniversary this month is the 250th anniversary of the birth of William Cobbett, best known for his book Cobbett’s Rides, a topographical narrative of his travels around the south east of England still available in Penguin Classics form. The map I have chosen to illustrate this was published in A Geographical Dictionary of England and Wales, by Cobbett in 1832. The map shows an outline of Hampshire, in an almost unrecognisable shape - either a very strange projection or a bad map! The only features are the main towns.

Cobbett was born in Farnham, Surrey, and his grave can still be seen in the parish churchyard. At various times he was a sergeant-major in the British Army, a campaigning journalist, a political prisoner, an exile in America, the editor of journals, and the Radical MP for Oldham. In the 1820s he returned from political exile in America and undertook a series of rides through the countryside as the basis for a series of articles for publication in his own journal The Political Register. In 1830, he made a selection of the rides and published them in book form. http://www.geog.port.ac.uk/webmap/hantsmap/hantsmap/cobbett/cobbett1.htm         

Coming far more up to date for our third anniversary, this one actually happened 50 years ago when on 27 March 1963 the Chairman of British Railways Dr Richard Beeching issued a report calling for huge cuts to the UK's rail network.The map shows just how extensive our rail network used to be and even this one doesn’t show all the smaller branch lines that criss-crossed the country at the time. The initial report proposed the closure of over 6000 miles of railway and over 2300 stations. Some were reprieved, but over 1900 stations did close and the many ‘dismantled railway’ annotations that appear on OS maps bears testimony to just how many miles of track were decommissioned, with lots of the former lines now forming part of our long distance footpath or national cycle network routes.As one commentator noted, the name ‘Beeching’ quite often evokes a response normally associated with mass murderers and the report was deeply unpopular at the time. The Beeching closures failed in their attempt to eliminate BR's losses, achieving a saving of just £30 million, whilst overall losses were running in excess of £100 million per year. Beeching himself was unrepentant about his role in the closures: "I suppose I'll always be looked upon as the axe man, but it was surgery, not mad chopping." 


What do the following have in common?
  • Maps as music
  • Edwardian transport planning
  • Smells of Paris
  • Pacman
  • The map of 1000 cuts
  • Maps in the media
  • Word maps
They all featured in the Design Group’s excellent one-day workshop entitled ‘How maps inspire us’ at the Steer Davies Gleave offices on 14th March. It really was a fascinating day that took aspects of cartography that we are familiar with but looked at them from a totally different viewpoint.
We were treated to some very engaging talks from a range of speakers and it was noticeable that similar themes kept being picked out. The underlying theme was the sense of place and how we move from being in a ‘space’ to being in a ‘place’ by the things that we associate with it through a variety of senses.. We considered the associative elements of senses and what reminds us most of particular locations – think how often a smell can make you remember a particular place.

Looking ahead:
  • If you haven’t yet booked for the talk by Michael Palin at the RGS on 12th April it’s not too late to do so. Entitled ‘A life in Maps’, it promises to be a fascinating evening from one of our ‘National Treasures’. Book your ticket now
  • BCS will have a panel on the IMIA stand at the London Book Fair from 15th-17th  April, so if you are attending, please make sure that you come and visit us to see the pre-publication details of the BCS 50th anniversary book. Due for publication later this year the book celebrates 50 years of the Society by selecting a UK event and world event from each year and illustrating it with an appropriate map.
    Pre-publication price will be £12.50, so keep an eye on the website in the near future for details.  
Pete Jones MBE, CGeog, FRGS
26th March 2013

Blog List