Showing posts with label Christmas. Show all posts

Wednesday, 24 December 2014

BCS President's Bulletin December 2014


I need to start this bulletin with an apology for an error that was pointed out to me by Roger Smith in New Zealand. In the last bulletin I featured a brain map which was credited to Nico Lambert. Nico did tweet the image but he never claimed it was his – the rightful owner/cartographer is a Kiwi, Sam Brown from Wellington. My apologies to Sam for the mistake.

Roger also sent me a link to a short video file about New Zealand’s GeoCart Conference held in Auckland a few months ago. This is a biennial event, which he describes as “always lots of fun and very rewarding.” Sounds just like a BCS Symposium then! https://www.youtube.com/watch?v=Ig3MlkXKEag

Talking of the Symposium, next year it will be held jointly with the Society of Cartographers in York. We have talked about joint events on several occasions and they have indeed taken place in the past, but this will be the first in over ten years. Although the exact venue in York is still under discussion we will be convening from 7th to 9th September, with the 7th being the Special Interest Group day, followed by two full days of talks, workshops and the Gala Dinner and Awards Ceremony. There are only four months left before the Awards close for 2015. So please do enter all the maps you will have produced between 1st May 2014 and 30th April 2015. The BCS President’s Annual Golden Ball Golf competition will take place on Thursday 10th September. So for all the budding BCS golfers out there, start honing your skills in the New Year. You've nine months to perfect your swings and putts, emulate Rory McIlroy and win the prestigious Golden Ball Trophy!

In early December, BCS had a stand at GeoDATA London 2014 and it proved to be yet another excellent event. The stand was busy all day with a steady stream of visitors and we handled lots of enquiries as well as signing up several new members. The one theme that persisted all day was a desire for training in cartography, especially from GIS practitioners, most of whom had never had any formal cartographic instruction. We are planning to re-launch our ‘Better Mapping’ workshops in 2015 to try and address this gap in practitioner knowledge. We are also intending to launch a Local Authority Special Interest Group in the early part of the year to address their particular needs. So if you work for a Local Authority and would like to join it or if you have any specific suggestions and ideas as to what you would like to see covered in it please do contact me directly in the post Christmas lull as we need your input as soon as possible.

The next generation of cartographers (all under 12 years of age) showcased their talents in Ordnance Survey’s recent competition to design a map of where Santa lives. Judging by the pictures on their blog they had tens of entries and some very inventive ways of depicting the theme including paper, computer and Minecraft worlds! Of course, the prize was a visit to see Santa in Lapland so no wonder they had so many entries! India, aged 7, from High Wycombe was the lucky winner. Full details at https://www.ordnancesurvey.co.uk/blog/2014/12/santa-map-competition-winner/

There are some exciting developments for 2015 with two major initiatives planned or underway. The first is a major development with relation to the Cartographic Journal, which will be available online in the New Year. This reflects the way that most journals are now circulated but paper copies will still be sent out to members. Whilst on the subject of the Journal I need to say a big thank you to Ken Field who has just stood down as editor after 9 years. The Cartographic Journal has thrived under his editorship and is one of the pre-eminent journals in the field with authors so keen to be published that we have a lot of articles awaiting publication.

The second development is that the Society website is finally undergoing a major overhaul and between now and its completion I would like to ask for members to be patient with the 'work in progress' and to remind them that the Society is staffed by volunteers, without whom it would not exist.

Cartography on the Internet

As the fight against Ebola in West Africa goes on, the part that maps have played in helping to combat the disease is spelt out on the MapAction website, concentrating on their deployment to Sierra Leone since September. The MapAction mission was to use their mapping skills to help decision-makers ensure that adequate treatment facilities were being provided in the right places and to identify the most effective means of stopping the transmission of Ebola. This work was supplemented by mapping the number of cases against building density in Freetown and advising the water and sanitation authorities where to put fresh water tap stands, something which has echoes of John Snow’s cholera map of London in the 1800s. Full details of all of the MapAction maps can be found at http://www.mapaction.org/component/mapcat/georss.html?deployment_filter=232.

'With modern satellite technology and GIS capabilities the whole world has now been mapped'. Actually, no it hasn’t. There are still large swathes of the planet that have not been mapped, or at least if they have been mapped it is at such a small scale as to be very limited in use. A recent article on the BBC website examined some of the reasons why some areas of the world are not well mapped and whilst some elements of the article are questionable it is an interesting piece. It also mentions the ‘Missing Maps’ project, an initiative to map the most vulnerable places in the developing world, in order that international and local NGOs, and individuals can use the maps and data to better respond to crises affecting the areas. Based on the Open Street Map concept, anyone can join in to add detail to those parts of the world where mapping can make a huge contribution to disaster relief efforts and humanitarian projects. The image shows a group of contributors at a ‘Missing Maps Party’, a wonderful example of collaborative cartography.

Perhaps we should be asking if our planet is even the best mapped in the Solar System as USGS has just announced the creation of  its most detailed map yet of Mars.

Whilst I fully appreciate that the London Underground Map has been much abused and parodied with all sorts of topics being fitted to its network, there is a recent one which I think really works and is actually useful and interesting. LONDONIST have produced a medieval tube map, favouring Domesday Book names primarily to show what would have been at the stations hundreds of years ago. Many names are recognisable even if in a slightly different form and it is interesting to see how big London was at the time and how so many of the outlying villages have since been swallowed up in the urban sprawl. As the site notes, they have omitted the Docklands Light Railway as most names would have simply been a variation on ‘marshland’.

Staying with London, the picture shows plans for a redevelopment of Charing Cross bridge to remove
the railway and add in shops. I don’t think a bridge with shops on has existed in London for centuries, but it was obviously given some consideration even if it never materialised. The site also includes some lovely visualisations of what the scheme could have looked like and a photo of a very detailed 3D model that was made.

ICA Map Carte

A curtailed selection this month, as there are 7 more maps to come in December. Perhaps India's Santa Map should feature on 25th December? My first selection is the 'National Geographic Atlas', which I was going to call a timeless classic, but then it has only been around since the 1960s, so is it still a little early to earn the description? Whether it is or not, it remains a great example of clear and simple cartography and a ‘house style’ that is instantly recognisable.


My second selection is William Smith’s 'Geological Map of England and Wales and parts of Scotland'. It is the subject of Simon Winchester’s book, ‘The Map That Changed the World’ and which I can thoroughly recommend as a good read. Having seen the full-sized map by William Smith at the Geological Society of London’s offices, it is a truly awe-inspiring map in its complexity as well as its simplicity. Can you have something that is both complex and simple? Well, I would argue that you can in this instance. 'Complex' in the nature of the subject that he was studying, yet 'simple' in the layout and depiction, which thus renders the underlying details with remarkable clarity.

My final abbreviated selection is the 'First World War Trench Map of Guedecort', although any one of the extensive series could have been chosen. Setting out to war with old and unsuitable maps at a variety of scales, British troops very soon came to rely on the new 1:10 000 series of maps that eventually covered the whole of the Western Front. Using conventional survey techniques and incorporating detail taken from aerial photography, these maps were updated on a very regular basis to ensure that the latest military situation could be communicated rapidly. Under the conditions at the time it is amazing to think of Field Survey Companies producing and printing maps in the field of such a standard and in such great quantities. Incidentally, a set of 7 commemorative map reproductions, originally produced for the 90th Anniversary of the First Battle of the Somme, are still available at a very reasonable sum indeed. Contact me for details using the addresses at the foot of the Bulletin.

And finally

Jeppesens have been planning ahead and it looks as though Santa has been cleared to land.
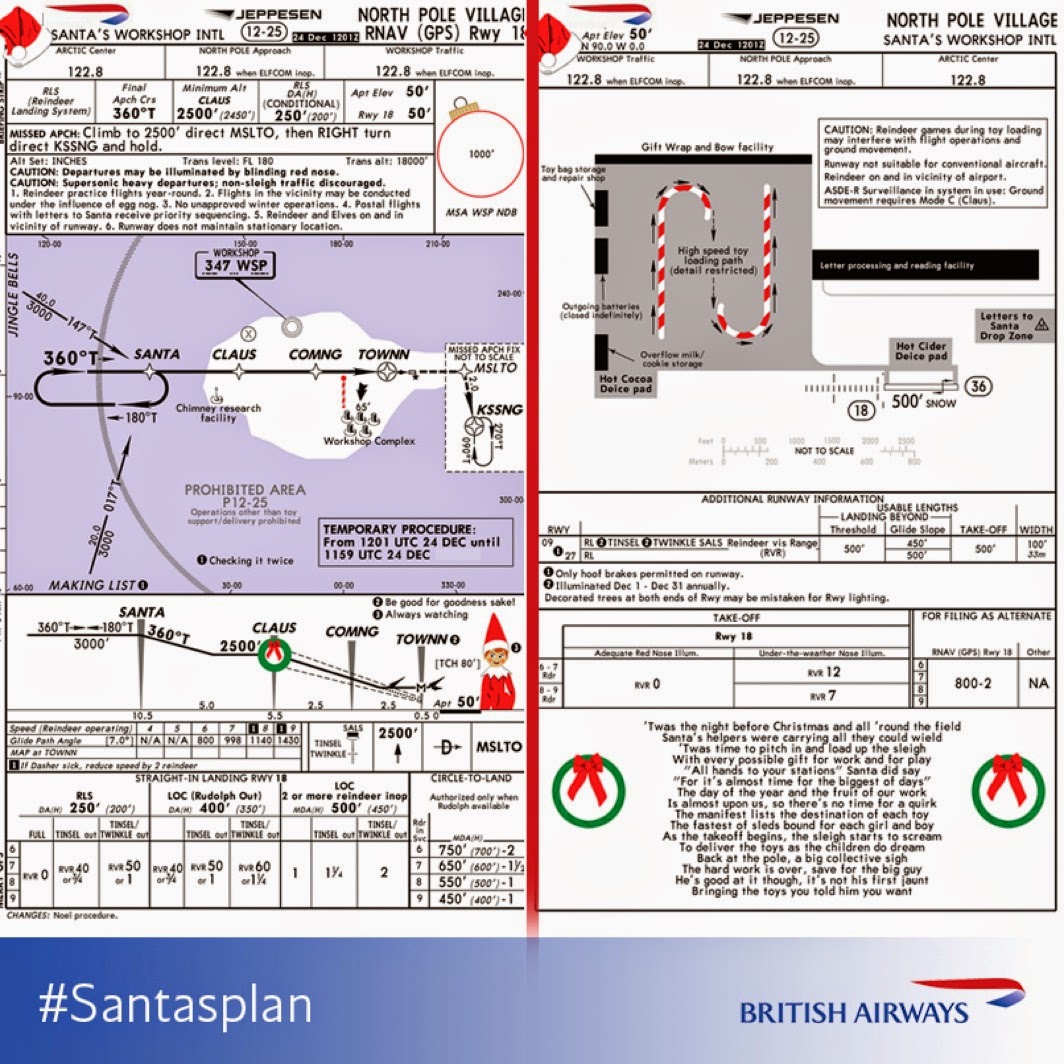

I know that I posted this a couple of years ago, but thought that it was time for a reminder that you can keep track of Santa as he delivers gifts around the world. NORAD’s sophisticated tracking system follows him on his journey and if you want to make sure that you are tucked up and asleep before he arrives, check out http://www.noradsanta.org/ for his progress.

Very Best Wishes for Christmas and the New Year.


Pete Jones MBE FBCart.S CGeog
24th December 2014

E-mail: peter.jones991@mod.uk
Twitter: @geomapnut


Friday, 20 December 2013

BCS President’s Monthly Bulletin December 2013


Anniversaries
So we come to the final bulletin of our 50th Anniversary Year and December was obviously a quiet month in 1963! There are very few really ‘mappable’ events from 50 years ago, but one that does lend itself is Kenya’s independence.

As the BBC reported it at the time:

Jomo Kenyatta is certain to become prime minister after his party, Kenya African Nation Union, won the country's first general election.
Thousands of Kenyans ran through the rain-drenched streets of Nairobi tonight cheering at news of the results.”

At a time when the celebrations for the life of Nelson Mandela have just taken place, there are some poignant echoes from Kenyatta’s speech in which he said that although his government aimed to free itself from British colonialism, it would not try to avenge past injustices.

"We are not to look to the past - racial bitterness, the denial of fundamental rights, the suppression of our culture... Let there be forgiveness," 

Kenya is now the biggest and most advanced economy in east and central Africa but it is still a poor developing country. The important agricultural sector is one of the least developed, employing 75 percent of the workforce. 

Despite western donors' early disillusionment with the government, the economy has seen much expansion, evidenced by strong performance in tourism, higher education and telecommunications.

For an eighteen day period, from 19 Dec 1963 – 5 Jan 1964, the Berlin Wall was opened for the first time, allowing West Berliners to visit family living in East Berlin during the Christmas season. One-day permits were required. In what was a foretaste of things to come, this could be considered a brave move on the part of the authorities at the height of the Cold War.

Under an agreement reached between East and West Berlin, over 170,000 passes were eventually issued to West Berlin citizens. Loudspeakers in East Berlin greeted visitors with the news that they were now in "the capital of the German Democratic Republic," a political division that most West Germans refused to accept. Each visitor was also given a brochure that explained that the wall was built to "protect our borders against the hostile attacks of the imperialists." On the West Berlin side, many newspapers berated the visitors, charging that they were pawns of East German propaganda.

Cartography in the news
Just one article this month. The healthy debate on Sat Navs v Atlases will be going on for some time yet and I came across a well-balanced, short article that manages to come to a nice compromise:

Posted by Louisa Keyworth at BCS Corporate Member, Lovell Johns, it does contain the rather worrying quote, “With geography in schools containing less teaching on map reading, two thirds of under 25s would literally be lost if you asked them to read a map, research has claimed.”
Obviously we need to refocus Restless Earth on UK Road Atlas skills!

Mary Baker Eddy Library Mapparium

I came across this stunning piece of cartographic art via a twitter post and have been amazed by the sheer scale of the Mapparium. This glass globe is located in the Mary BakerEddy Library in Boston, Massachusetts. It is constructed of 608 glass panels based on the 1934 Rand McNally world map. The Rambusch Glass Company artists traced these maps onto 1/4 to 1/2 inch thick glass panels and painted them with a coloured powdered glass mixture. Each panel was then fired in a kiln to fuse the colour to the panel. Construction on the Mapparium began in April 1934 and by January 1935 the glass panels were being produced at a rate of about 50 per week, with production accelerated to complete the entire project for June 1st 1935. Once the panels were completed, they were fitted into the spherical bronze frame forming a 10° by 10° graticule that holds the entire structure together. Finally, 300 light bulbs were installed to illuminate the globe from the outside. The total cost for the project was about $35,000 (about $600K in current terms).

Designed by Boston architect Chester Lindsay Churchill, he called his installation the “Mapparium”. It was an immediate and overwhelming success. Within the first four months, more than 50,000 people had come to experience "being at the centre of the earth".

Despite being on a concave surface, which is the complete opposite of how we normally view a globe, it just looks right. Distances, areas and relative locations are all perfectly maintained and as the eye is always the same distance from the object, it doesn’t encounter the distortions that looking at a normal globe introduce.

The Mapparium was renovated in 1998 when a new light and sound system was installed and the panels were cleaned and repaired. On three occasions in 1939, 1958, and again in 1966, different committees discussed updating the map to reflect the geopolitical changes that had taken place since 1934. In 1966, the estimated cost was $175,000 to create and install new glass panels. It was decided that the Mapparium held much more value as an art object, and the idea of updating it was finally dropped.

It remains the only one of its kind, a truly unique cartographic item. I did muse in my twitter feed that it would be nice to have one on this side of the Atlantic as well. We learnt a lot about the UK glass industry during the Black Country Experience weekend, so if anyone knows of a donor with about £400,000 that they are looking to invest and a building with a space large enough to house it please do let me know!
(images provided by kind permission of the Mary Baker Eddy Library)

Better Mapping
We will be looking at a new format for the Better Mapping Seminars in 2014, based on what we have done before but revamped and refocused on web cartography and designing for multiple media. There will still be an opportunity to look at examples of what works and what doesn’t work and I came across a good example recently of a map that at first glance looks good, but then you start to see problems. I am not going to ‘name and shame', you will have to come along to the seminars to find out. Suffice to say that it was produced by a design company, not a cartographic firm and from their website you do get the impression of a certain lack of understanding.

“Mapping


Maps are a perfect example of the importance of good information design. They are functional items and not like conventional packaging or written instructions. Packaging has to be attractive, in the true sense of the word, and information design must be attractive too, in order to capture the readers’ attention in the first place. However, the primary function of any map is to help the user to plan or find his way.

Producing one that achieves this is no mean feat and it is routinely under-estimated how complex a task it actually is – when done well. Maps can fail in two basic ways: they can of course simply be inaccurate and the outcome becomes obvious, but often only when used; they can also fail when the factual content is sound, but presented poorly. Everything on a map is symbolic and all facts are conveyed by implication alone. Maps are not like written instructions and a high cognitive load is being put on the user.

Different situations require different mapping solutions. A geographical map may be ideal in one context and a straight line diagram better in another. Scale is usually very important and simply making a map bigger or smaller is not what scale is about. Scale is about proportion and content.”

Restless Earth
I am very pleased to confirm that the Great Britain Sasakawa Foundation (GBSF) have approved a grant of £2,500 to support the BCS RestlessEarth programme. This is the second consecutive year that the GBSF have supported us with a financial grant and it enables us to continue to offer the workshops to schools totally free of charge. We are very grateful for their continued support. To find out more about GBSF, please visit their website at www.gbsf.org.uk/.

And Finally…
As we come to the end of our 50th Anniversary Year, I hope that you will agree that it has been an incredibly successful celebration of The Society. We crammed an incredible amount into the last 12 months, have had some very high-profile speakers, run an excellent Symposium, published our 50th Anniversary Book and participated in a wide range of cartographic and geographic events. We have recruited over 100 new members this year and our total membership is now around 700. I would like to thank everyone who has helped to make this year such a resounding success.

Do you read this far? I recently asked on Twitter if anyone new of a good explanation of what differentiates a chart from a map. It was sparked by a book that I am currently reading, from which the following is an extract:

“The stock-in-trade of this old gentleman comprised chronometers, barometers, telescopes, compasses, charts, maps, sextants, quadrants, and specimens of every kind of instrument used in the working of a ship's course, or the keeping of a ship's reckoning, or the prosecuting of a ship's discoveries.”

So my Christmas quiz question is, “What is the name of the ‘old gentleman’ referred to in the extract? First correct answer e-mailed to the address below wins a £10 voucher of their choice (Book, ITunes, M&S, etc).

Best Wishes for a Very Merry Christmas and a Happy New Year – let’s hope that 2014 proves to be as exciting and inspiring as this year has been.

Pete Jones MBE, CGeog, FRGS
20th December 2013

Twitter: @geomapnut

Thursday, 3 January 2013

BCS President’s Report December 2012


A Very Merry Cristmas and a Happy New Year

An early Christmas message as Roger our Administrative Officer is taking a well earned rest from Membership renewals for a couple of weeks.

Yes, it is a deliberate mistake in the title, I have dropped the ‘h’ from Christmas. Why? Well there is much debate about the correct use of English and dropped aitches have been around for many a year, but usually at the beginning of words. The example I found recently was more subtle and led me to wonder if a new word had been coined. Hopefully you will have spotted the error in the extract (left) from The Times list of ideal Christmas presents ‘For Him’. Firstly I would take issue with a book about maps being in the ‘For Him’ section and secondly just what is ‘cartograpy’? Is it a combination of maps and wine, which may be of interest to many, is it the mapping of wine regions? Either way, perhaps it’s a good excuse to raise a glass or two during the festive period as ‘map books’ are becoming increasingly popular and mainstream, showing that there is a continued and growing interest in the subject.

Maps produced by Mary Spence
On the subject of books, those of you who have bought, or may receive as a Christmas present, ‘Brazil’, the book that accompanies Michael Palin’s recent TV series, will be interested to know that the maps in the book were produced by Mary Spence, past BCS President and still very much involved with Programme Committee. We are very pleased to announce that Mary has persuaded Michael to give a talk to BCS members next year as part of our 50th Anniversary celebrations. The talk will take place at the Royal Geographical Society in London on Friday 12th April. Full details will be sent out in the New Year, but definitely a date for your diary.


The big event this month was the London Mapping Festival Mapping Showcase held at Lord’s Cricket Ground on 6th December. This was the culmination of the Festival and was a huge success. BCS had a stand at the Showcase and we were kept busy all day speaking to existing members and encouraging new members to join. We had taken along some examples of the Restless Earth resources and maps produced by Year 10 students, which generated a lot of interest.

The London Mapping Festival was the brainchild of the GeoInformation Group and I would like to offer them my congratulations on an excellent initiative. The 18 month-long festival encompassed a wide variety of events and I hope that you managed to get along to some of them? The Mapping Showcase was notable for the wide range of exhibitors, from the entire spectrum of the cartographic industry and the extensive range of attendees from the GIS professional to the self confessed ‘map nut’. There was also a good range of presentations throughout the day on some very thought provoking topics that are very relevant to the cartographic community at the moment. With over 500 registered delegates it showed that the industry is in very good health at the moment and The BCS needs to capitalise on this by further increasing our membership base and ensuring that we fully meet the needs of our members, no matter which sector of the industry they are working in.

50th Anniversary Events
Following on from the London Mapping Festival’s example, for our 50th anniversary year in 2013, we are aiming to hold events on a regular basis around the country to offer the chance to attend a BCS event to as many members as possible. A provisional programme has been put together by the Programme Committee, but if there is an area or event that you would like to organise, please do get in touch with us as we want the year to be as inclusive as possible. January sees the BCS having a stand at DGI Global from 22nd to 24th. This is aimed at the Defence community and is attended by delegates, as the name suggests, from a global audience. BCS has had a stand at previous events when it was DGI Europe and we have generated a lot of interest in the Society.

On 24th January the UKGEOforum 2013 Annual Lecture will be held at the Royal Institution of Chartered Surveyors in London. This year’s lecturer is Mark Ovenden and his lecture is entitled “How Beck's diagram re-mapped the modern world”. Early booking for this event is recommended as places are limited. Roger sent out full details of the lecture on 19th November. Mark was a presenter at the Symposium this year, where he delivered a workshop entitled ‘Making a practical transit map’ and from the delegate feedback it was very well received.

For those of you with children, or if you are just a big kid yourself, then you may be interested in keeping up with Santa’s progress on Christmas Eve by following him on the NORAD Santa Tracker website - http://www.noradsanta.org/. North American Aerospace Defense Command (NORAD) is a joint organization of Canada and the United States that provides aerospace warning, air sovereignty, and defence for the two countries and whilst Santa is not seen as a ‘threat’ he does get tracked every year. It’s good fun and is a useful persuasive measure to get children to bed, although given that they are usually so excited there is no guarantee of sleep I’m afraid. So log on and follow his progress across the world map and ensure that you are in bed before he arrives to deliver your presents!


Which, I think, just leaves me to wish you a Very Merry Christmas and a Happy New Year. Let’s hope that it is a peaceful and quiet time that we can enjoy with family and friends.

Best Wishes

Blog List